Particle Phase
pysammos.particle_phase package
Subpackage for particle phase analysis.
Mixture theory conceives granular mixtures to be populated by all phases with associated partial macroscopic fields contributing to a bulk field, where a phase can be defined as any particle property, or combination of properties, such as density, size, shape, elasticity, roughness. In Pysammos we consider a phase to be defined by particle diameter and density, since they two properties directly related to the two main competing mechanisms in segregation: kinetic sieving and buoyancy, two ubiquitous processes in natural flows.
In Pysammos the phase detection is carried out by clustering particle data using the k-means algorithm (see figure below). The optimum number of clusters is chosen to be that with the absolute maximum in silhouette value, a measure for how well each point matches its assigned cluster relative to the nearest neighbouring cluster (d in figure below). Afterwards, the k-means algorithm is applied to the dataset with the optimum number of clusters (e in figure below) to obtain the phase-ascribed arrays, which are stored as attributes of the class instance.
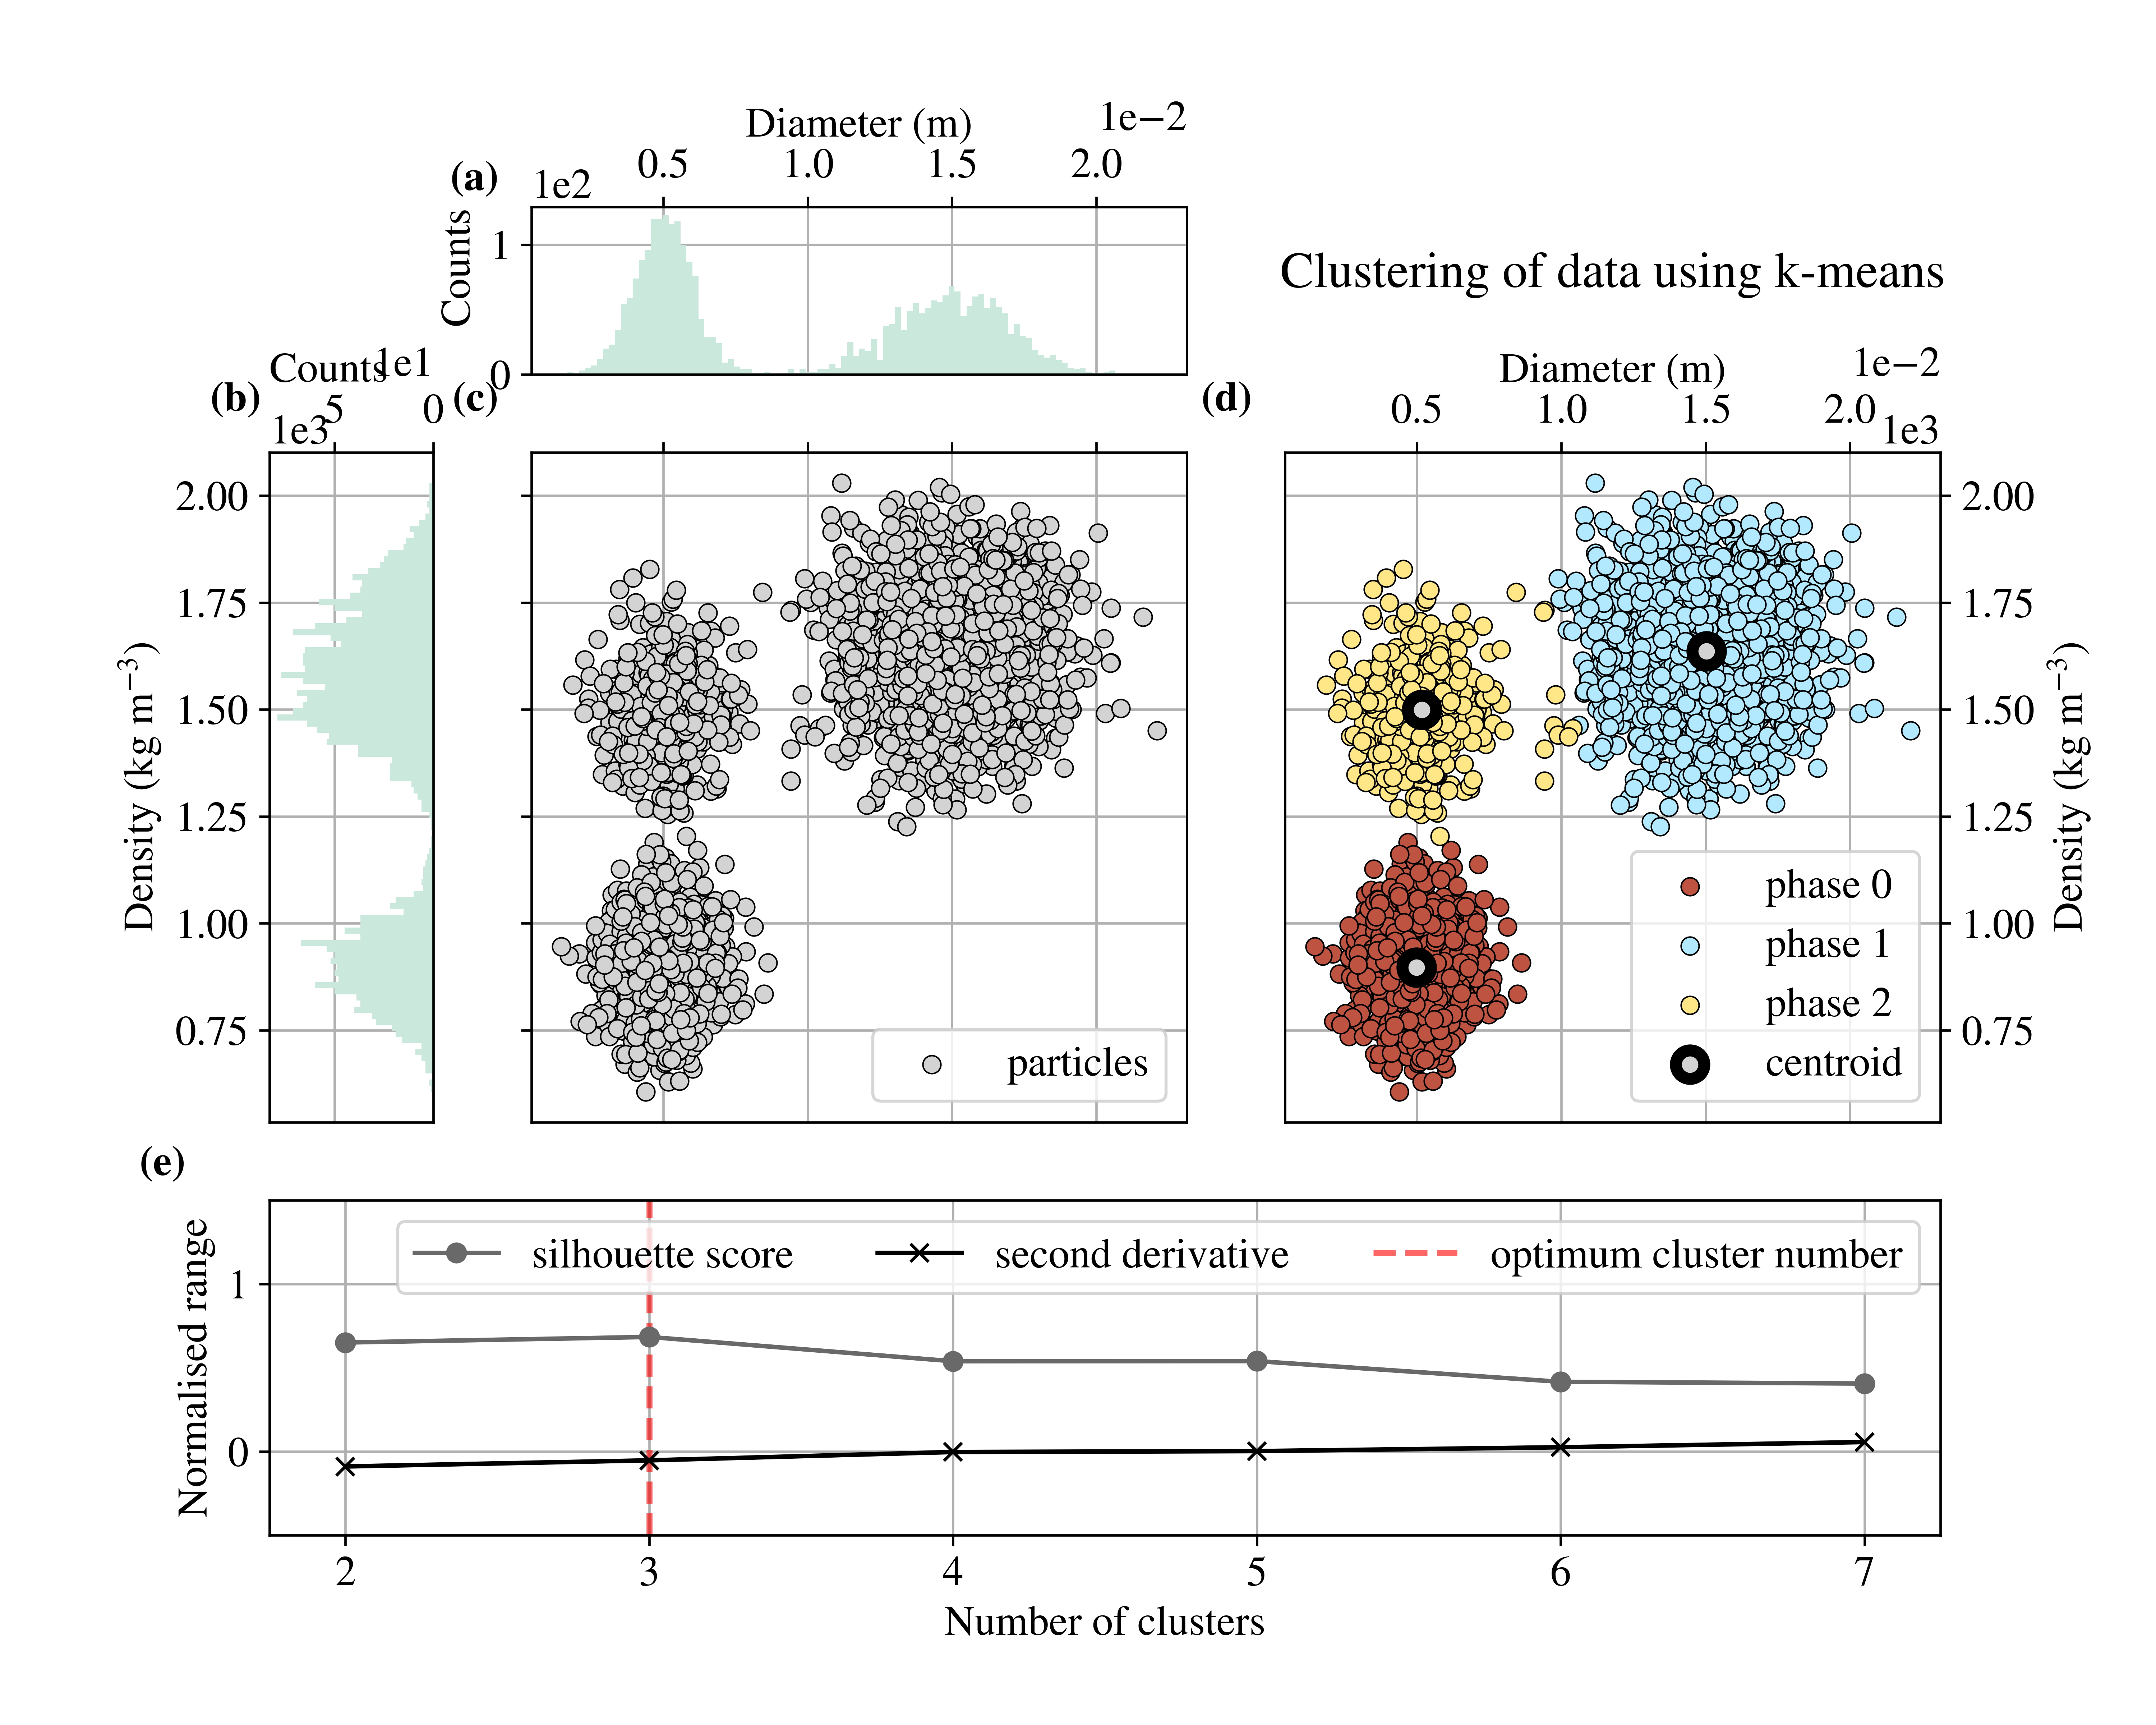
Example of particle phase clustering. Illustration of the approach to detect particle phases. Synthetic data set of a bimodal particle diameter distribution (a). Synthetic data set of a bimodal particle density distribution (b). Cross-plot corresponding to the diameter and density distributions in (a) and (b), respectively (c). Cross-plot containing the same particle samples as (c) coloured by the phase they are classified to according to the k-means algorithm using the optimum number of clusters (d). Silhouette score for a given number of clusters employed in the k-means algorithm (grey), and the corresponding second derivative (black) (e). The absolute maximum in (e) is chosen to be the optimum number of clusters (dashed red).
Clustering module
pysammos.particle_phase.clustering module
This module provides tools to identify distinct particle phases based on their physical properties, specifically particle diameter and density, using unsupervised clustering techniques.
- This module contains two main functions:
find_phases(): Applies KMeans clustering to particle diameter and density data to identify distinct phases.plot_phases(): Visualizes the clustered particles and their phase cent
The clustering approach incorporates silhouette score evaluation and curvature analysis to select the most meaningful number of phases, aiding in material characterization, mixture analysis, or other particulate system studies.
- pysammos.particle_phase.clustering.find_phases(particle_diameters, particle_densities, n_max)[source]
Determine particle phases by clustering diameter and density data using KMeans.
This function scales the input data, estimates the optimal number of clusters based on silhouette scores and the curvature of the score plot, then applies KMeans clustering to assign particles to phases.
Inputs
- particle_diametersfloat array, shape(N_particles,)
Array of particle diameters.
- particle_densitiesfloat array, shape(N_particles,)
Array of particle densities.
- n_maxint
Maximum number of clusters to test for optimal clustering.
Outputs
- phasesfloat array, shape(n_clusters, 2)
Cluster centroids in the original feature space (diameter, density).
- phase_arrayfloat array, shape(N_particles,)
Cluster labels (phase indices) assigned to each particle.
- pysammos.particle_phase.clustering.plot_phases(particle_diameters, particle_densities, phases, phase_array)[source]
Plot particle diameters vs densities colored by phase clusters with cluster centroids.
Inputs
- particle_diametersfloat array, shape(N_particles,)
Array of particle diameters.
- particle_densitiesfloat, shape(N_particles,)
Array of particle densities.
- phasesfloat arra, shape(n_clusters, 2)
Cluster centroids in diameter-density space.
- phase_arrayint array, shape(N_particles,)
Cluster labels for each particle.
Outputs
- None
Displays a scatter plot showing clustered particles and centroids.